Layout algorithm for visualizing Directed Acyclic Graphs (DAG)
Small experiment about Sugiyama layout algorithm
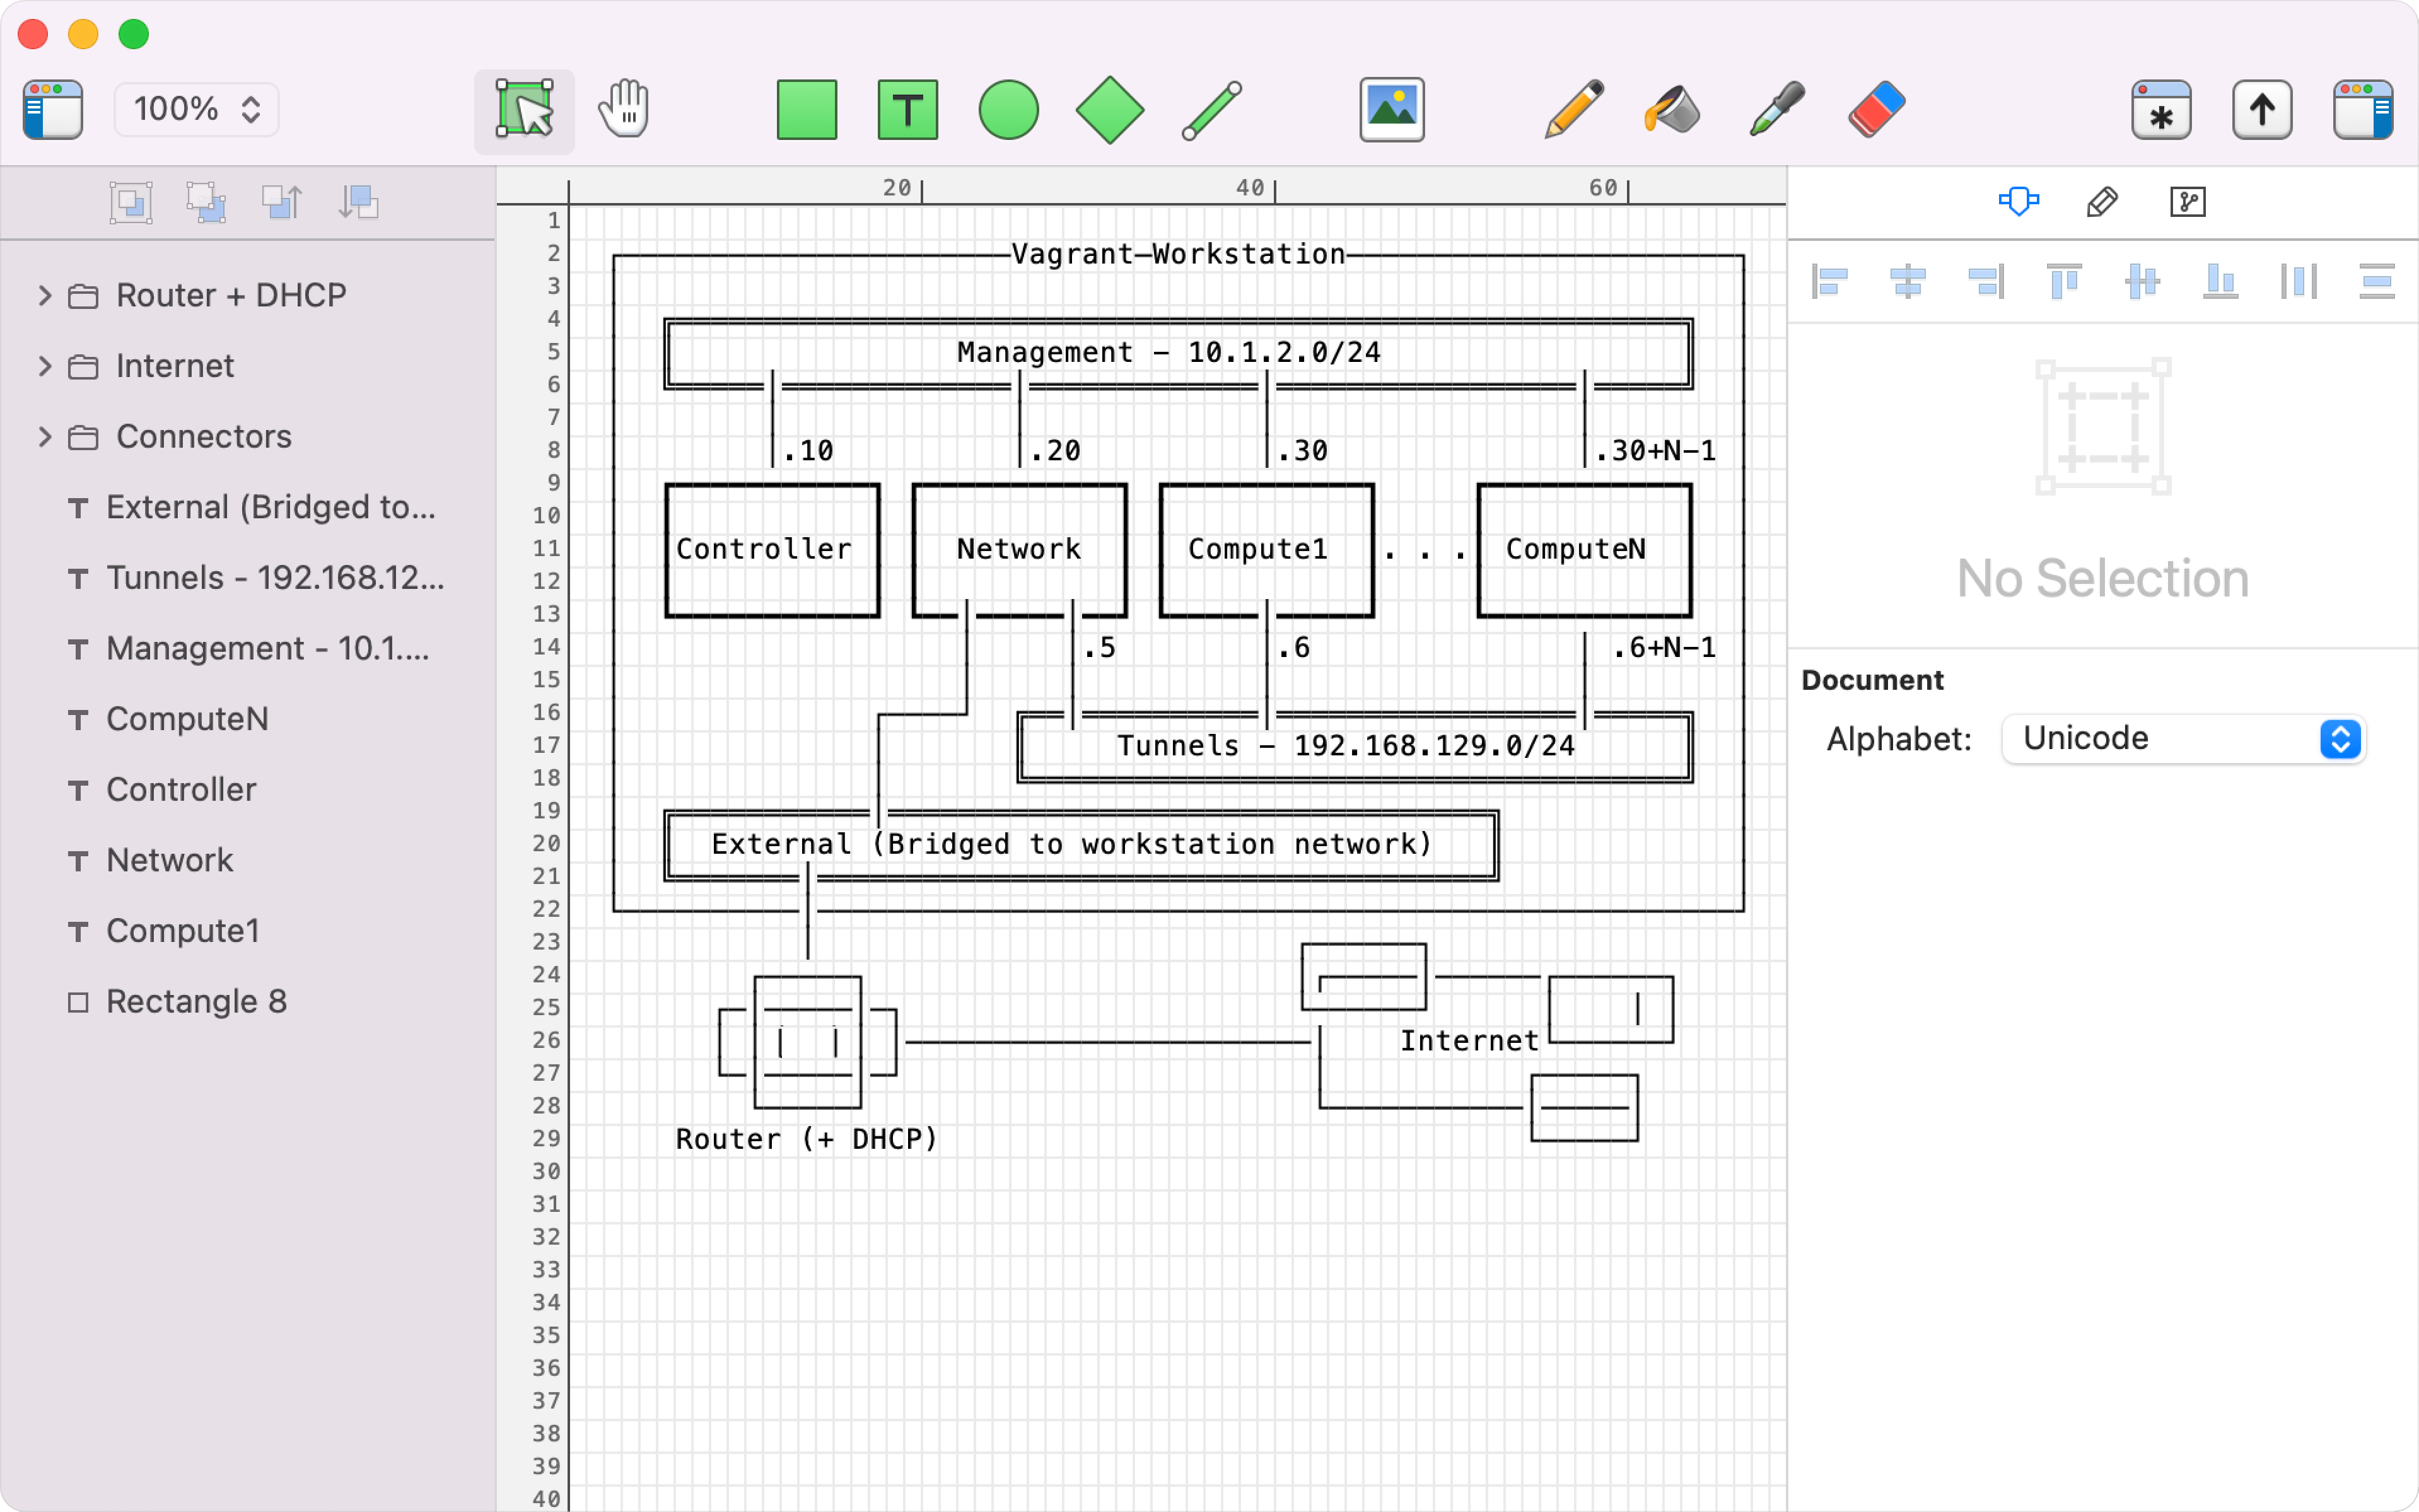
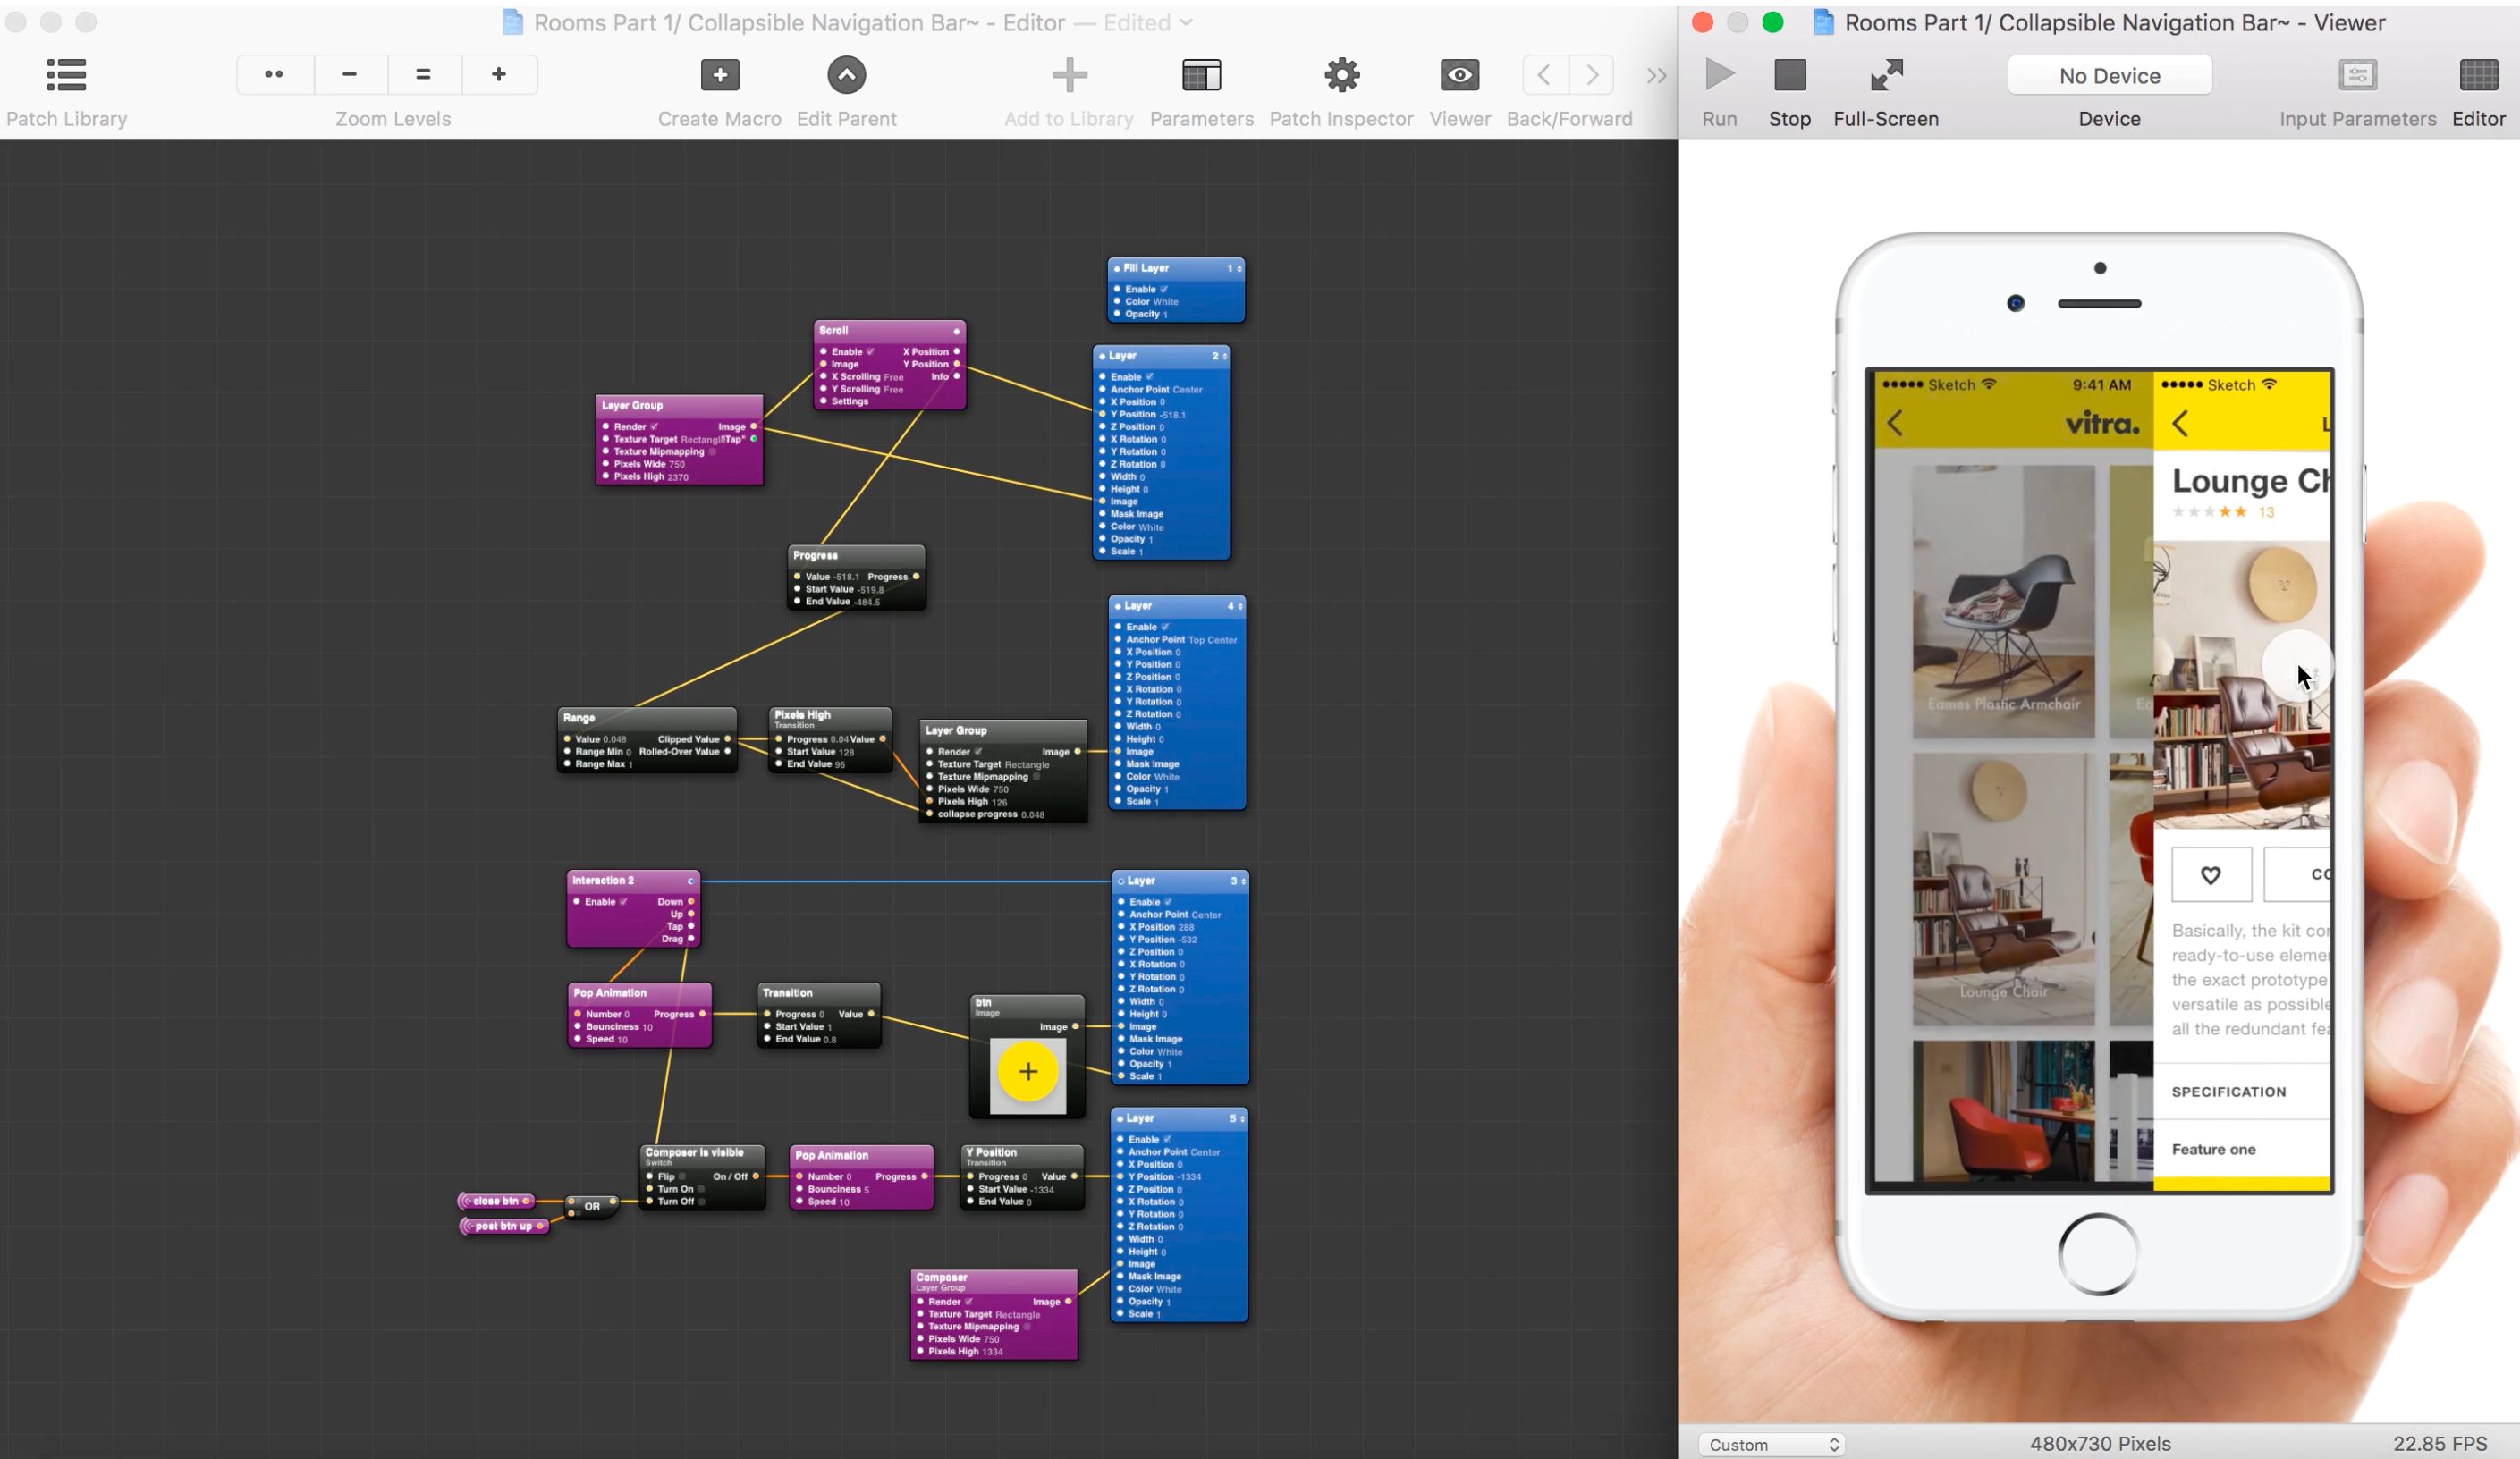
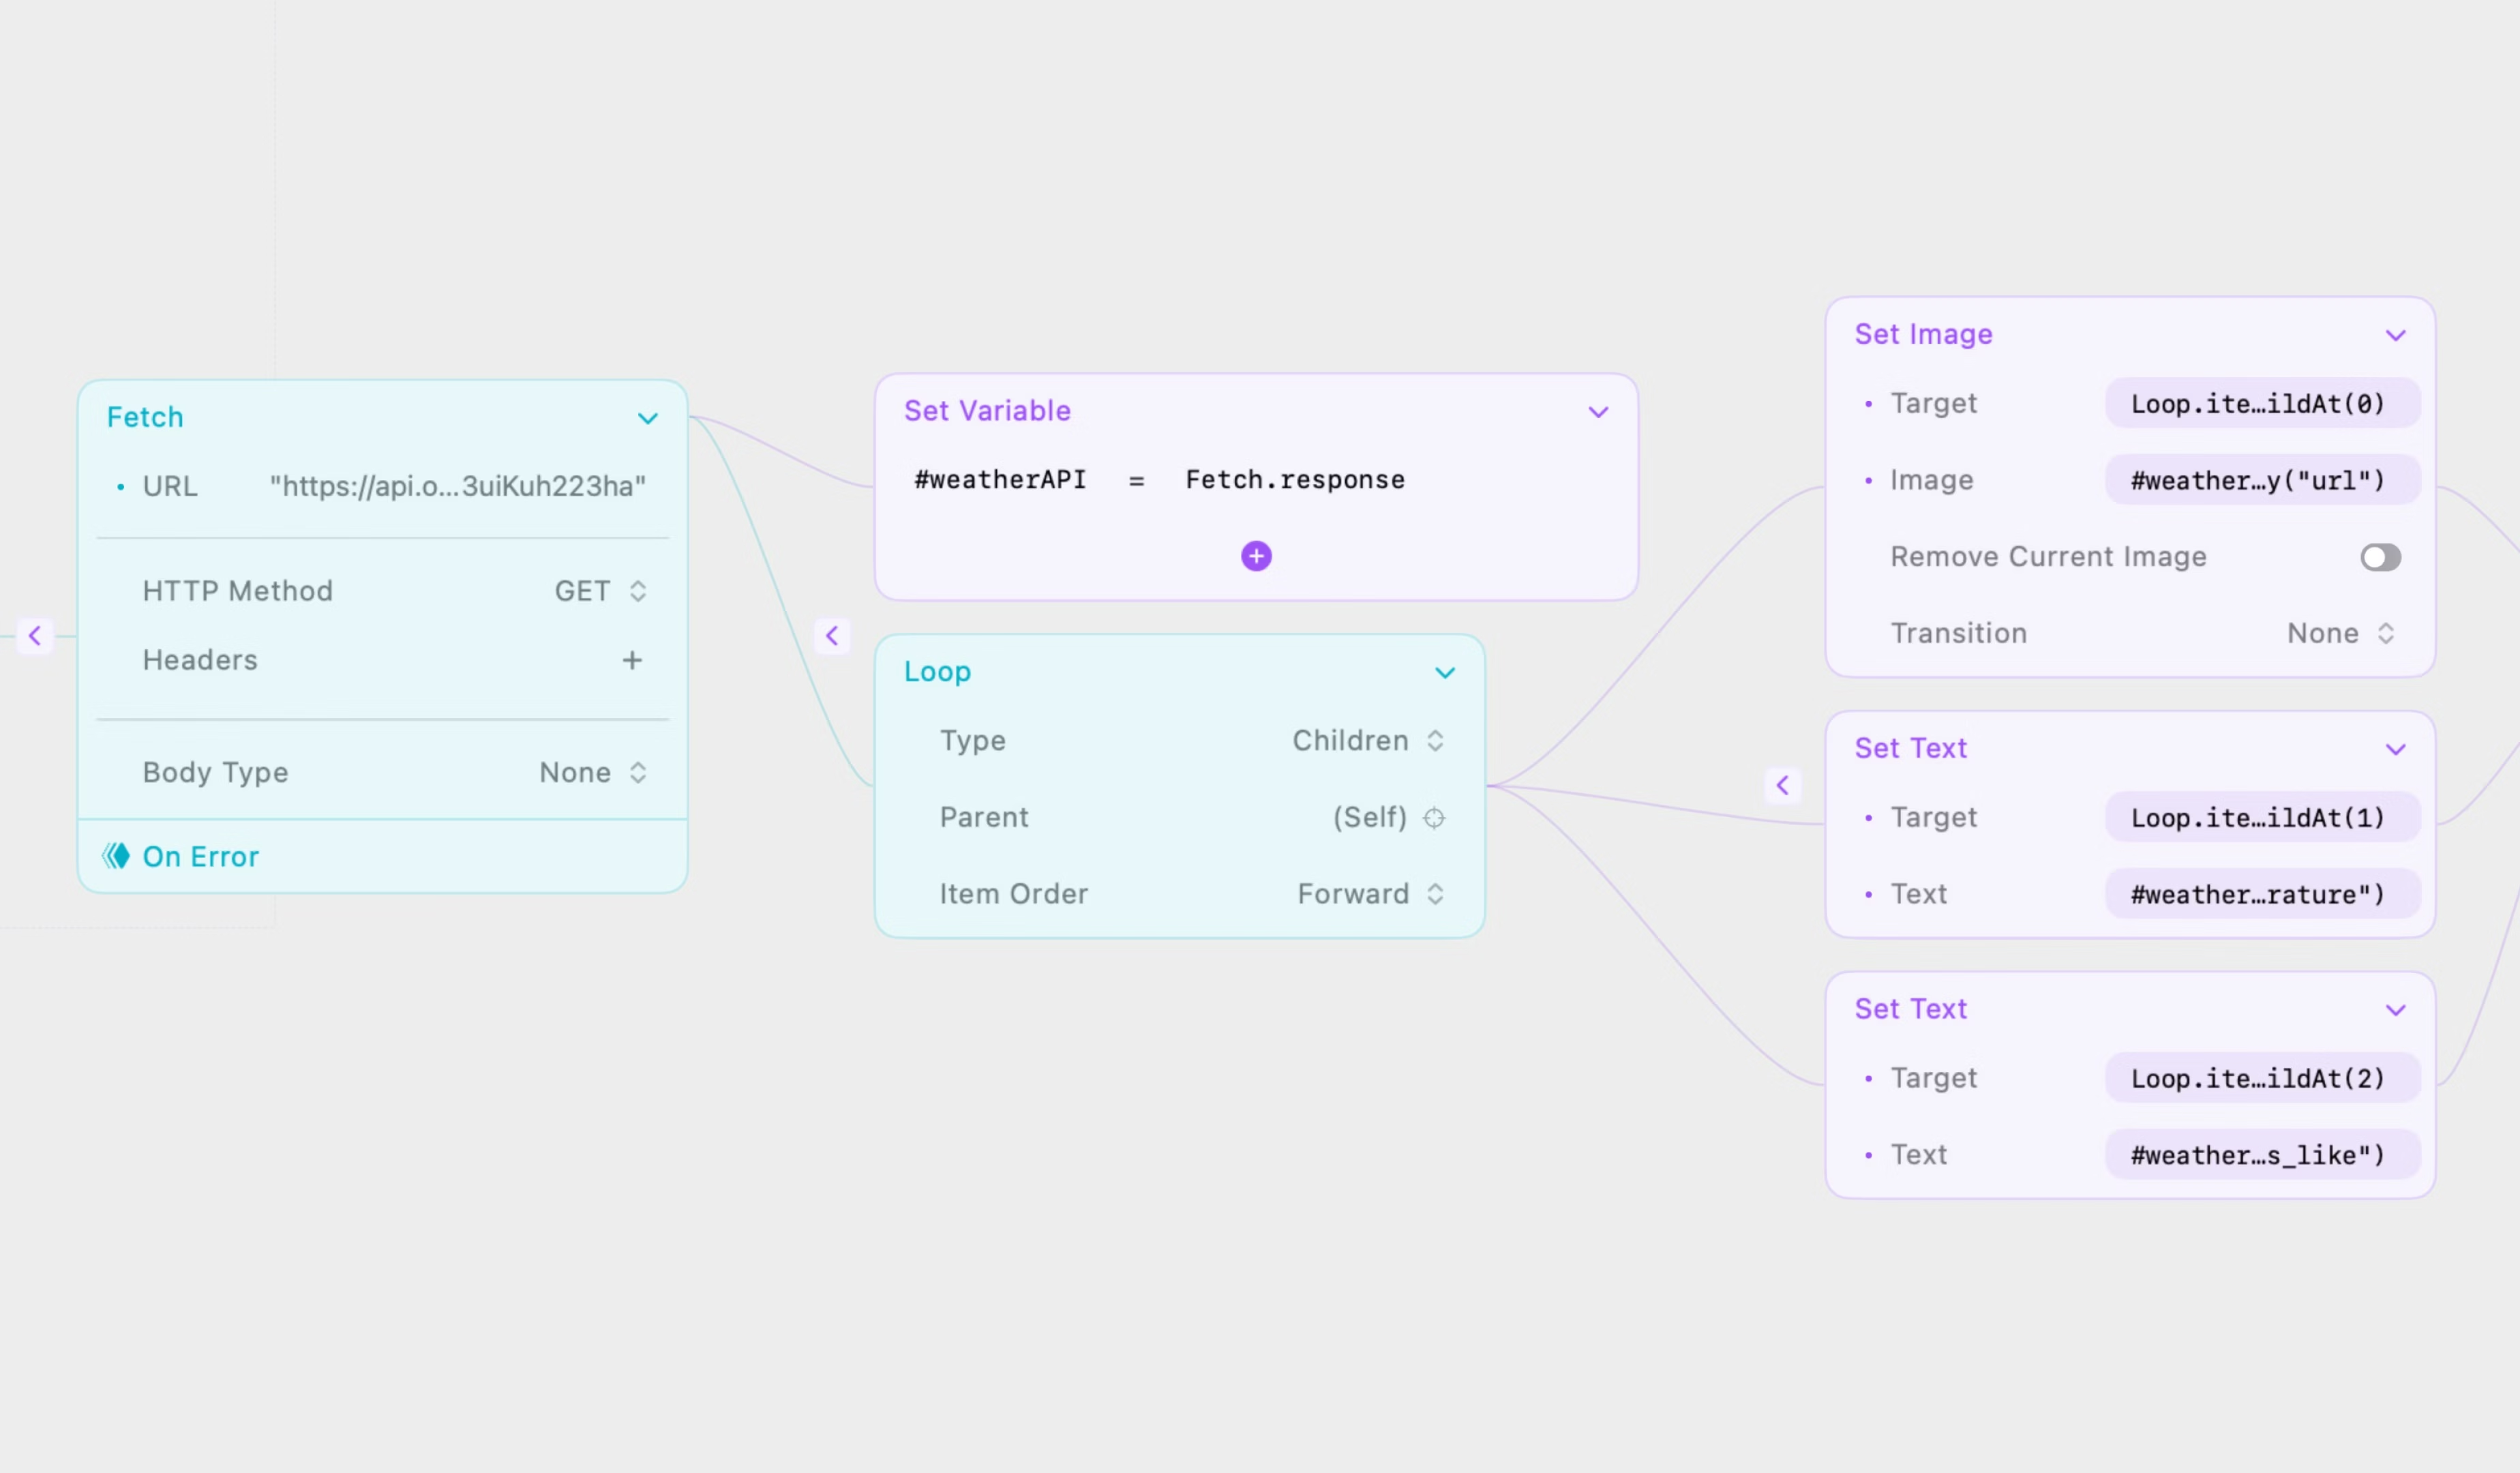
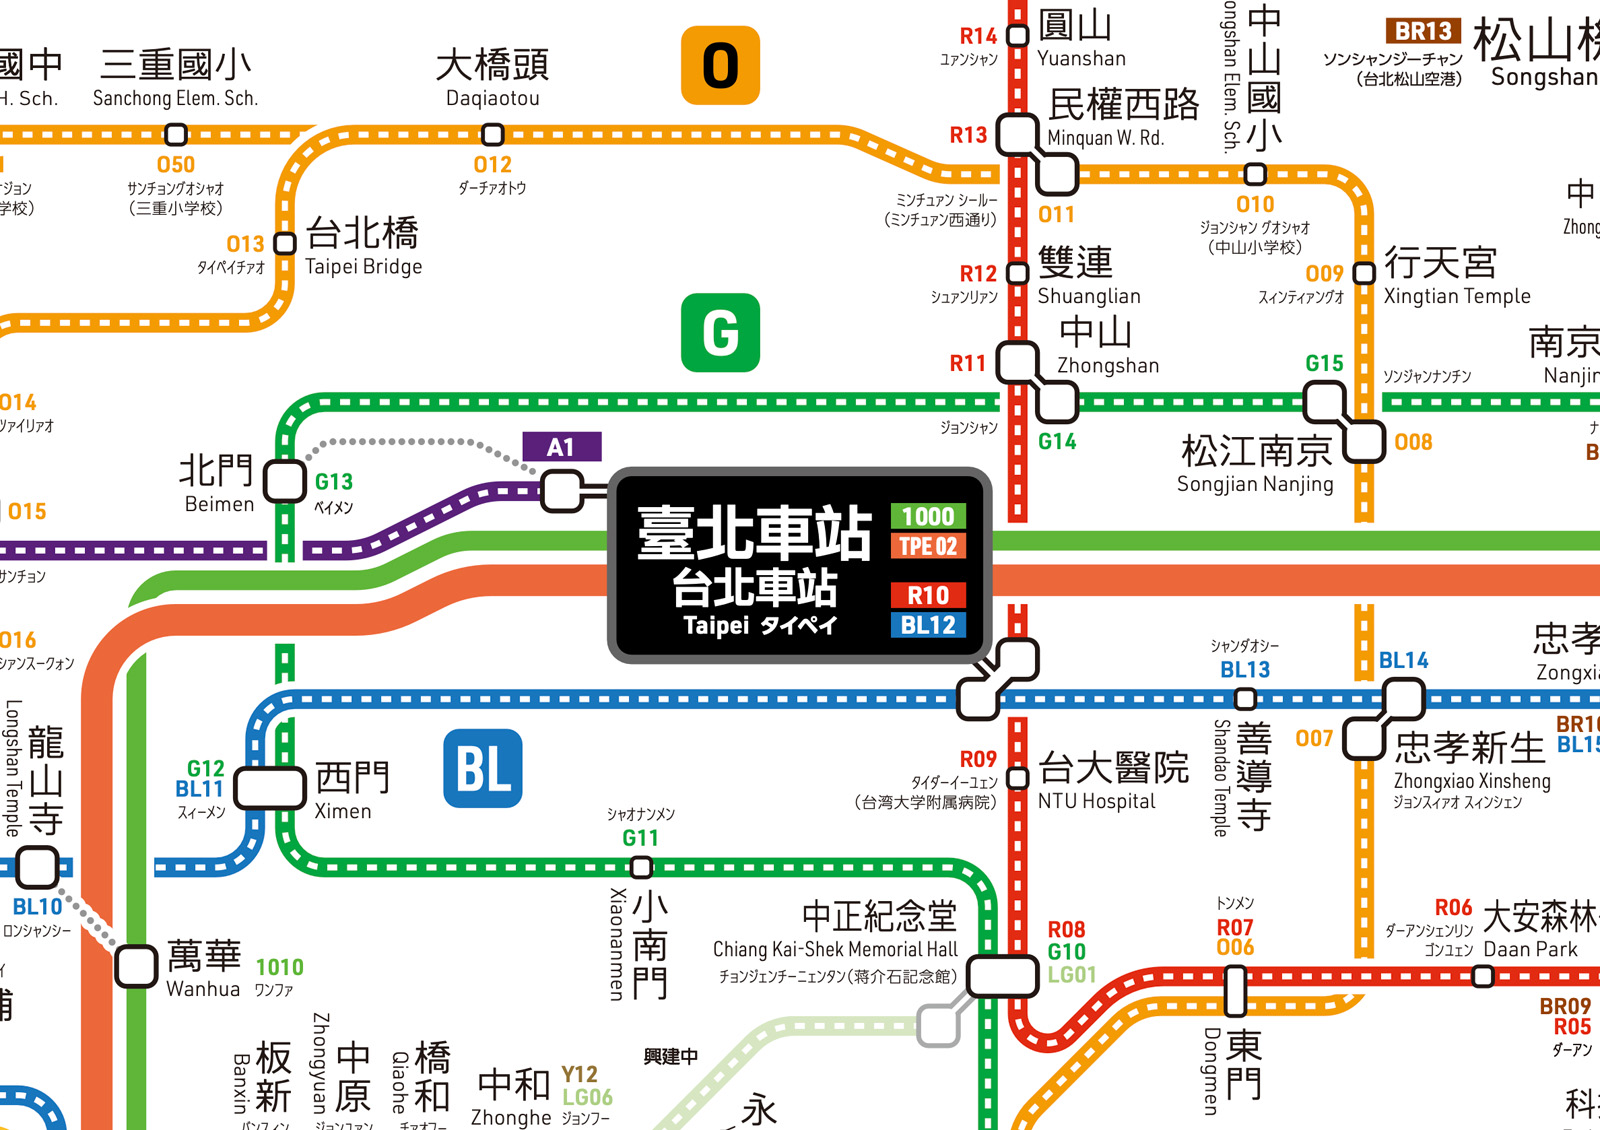
Diagrams have always fascinated me. From subway maps to wiring diagrams and API graphs, so much of how we understand complex systems comes from seeing structure visually rather than reading text.
A bit of history
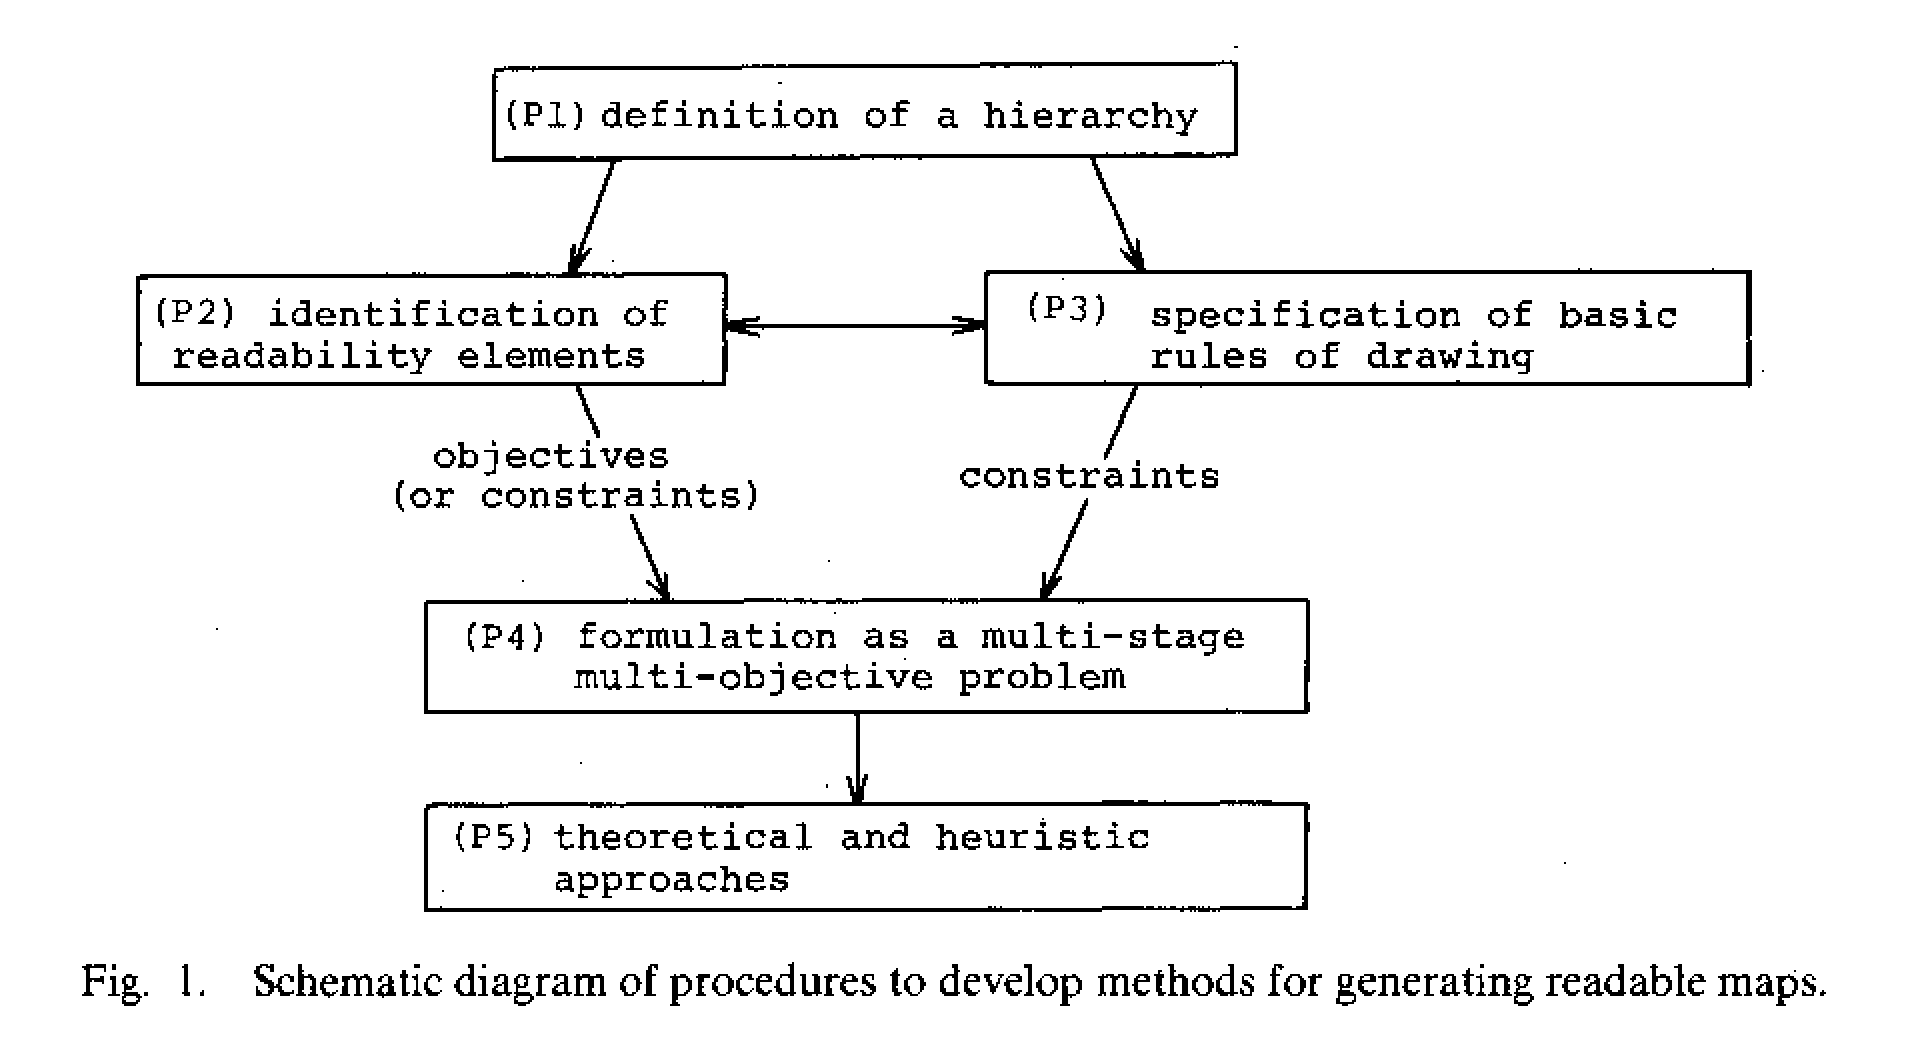
In 1981, Kozo Sugiyama, together with Shojiro Tagawa and Mitsuhiko Toda, published the landmark paper Methods for Visual Understanding of Hierarchical System Structures. Before this work, automatic graph drawing existed, but it was often messy: force-directed layouts treated graphs like physical spring systems, which worked well for undirected networks but struggled to express hierarchy and flow.
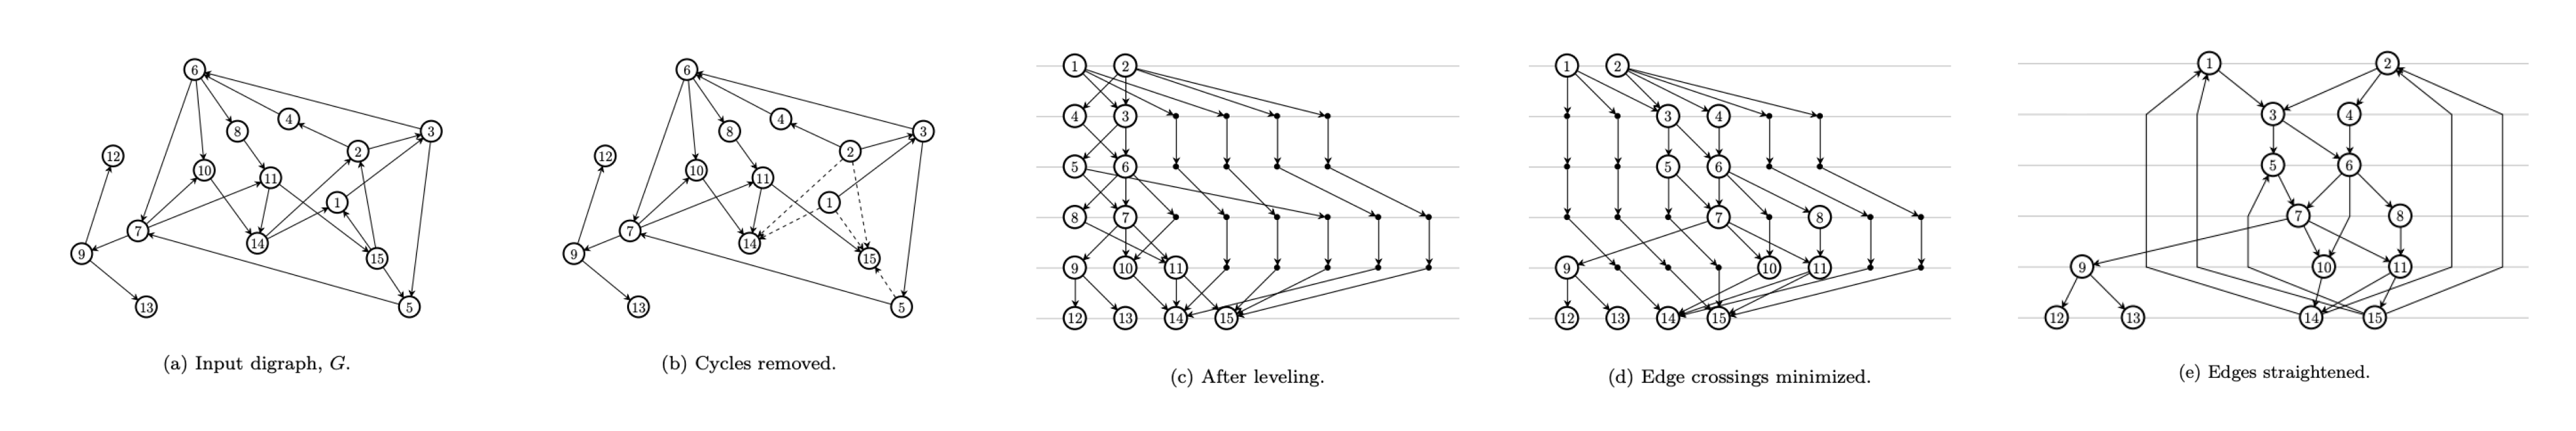
Sugiyama reframed the problem entirely. Instead of “let physics decide,” he proposed a structured, multi-stage pipeline: assign nodes to layers, order them to minimize crossings, and then position them cleanly on the page. This layered approach became the foundation of how we still visualize hierarchical systems today, from compiler graphs to workflow tools and organization charts.
Exploration
After reading Ben Visness’s write-up about how Mozilla applied this approach in the SpiderMonkey project , I wanted to understand how the algorithm behaves. So I built a small playground with ~1000 lines of layout logic. It’s still a simplified version, but building it helped me grasp the foundations, and also appreciate just how deep this field of research really is.
Industry Adoption
More than 40 years later, the Sugiyama framework is still the gold standard for hierarchical layouts. If you’ve ever generated a diagram from code, you’ve almost certainly used it already:
- d3-dag : It brings modular Sugiyama layout to the D3 ecosystem, with a relatively small package size compared to other options.
- ELK (Eclipse Layout Kernel) / elkjs : A powerful layout engine with a Java core and a JavaScript version. It supports ports, nested nodes, and sophisticated layered layouts, at the cost of a larger package (1.4MB for Elk.js).
- Mermaid.js : The popular markdown-to-diagram tool. Under the hood, it uses
dagre, a JS implementation of the Sugiyama method, and ships as a comparatively heavyweight bundle. - Graphviz (dot) : The grandfather of graph visualization. Its
dotlayout engine is the reference implementation of the Sugiyama method. It’s robust and fast.
Wrapping up
DAG layout is one of those problems that looks simple until you actually try it. The Sugiyama framework gives us a reliable foundation, but the real craft comes from tuning it to your constraints and use cases.
Whether you’re building a workflow editor, visualizing dependencies, or simply trying to make sense of a complicated system, knowing how these algorithms work helps you make better design and engineering decisions about how your data should be seen—rather than just drawn. 🎨